

The NAS group belongs to the Quantum and Computer Engineering Department in the faculty of Electrical Engineering, Mathematics and Computer Science (EEMCS) of the Delft University of Technology.
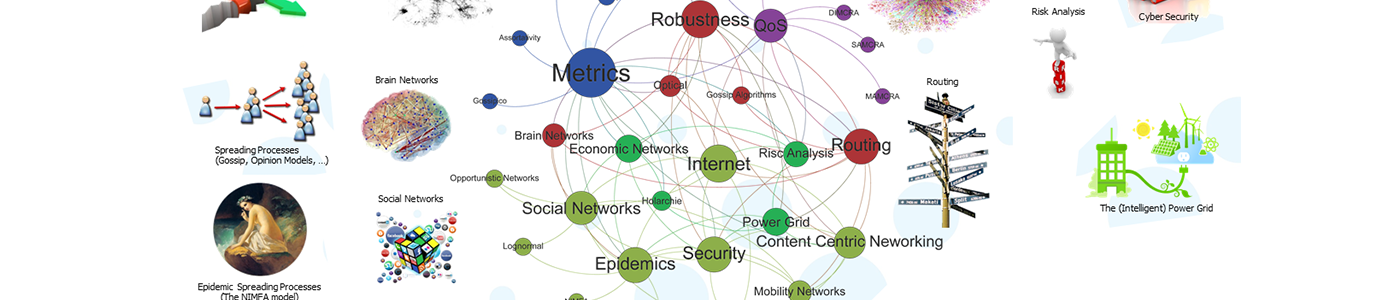
NAS educates and conducts research in the broad area of complex networks, ranging from man-made infrastructures such as data communications and energy networks, to biological, brain, social and financial networks. The emphasis lies on understanding network characteristics as well as the processes running on top of the network.
NAS participates in the Bachelor's program of Electrical Engineering and in the following Master Programs of Delft University of Technology:


For accessibility to the faculty of Electrical Engineering, Mathematics and Computer Science (EEMCS, building 36), please visit here.
The goal of a MSc project at NAS is to actively contribute to current research lines. The topics we investigate all relate to doing cutting edge research in Network Science. Because we routinely collaborate with industrial partners at KPN, TNO or Ericsson, we often facilitate joint MSc projects with them.
Throughout your MSc Project, we consider you part of the NAS research group. You will therefore be invited regularly to e.g. attend our meetings, research talks, and present your progress.
Your daily supervisor is also often available, and is usually a senior staff member or PhD student who is actively doing research. We also try to arrange a desk for you.
Let us share with you a list of topics that pertain to Network Science, and that we have supervised MSc projects on in the past. This will give you an impression of the range of topics MSc students have tackled in the past:
Each MSc project generally takes 45 ECTS worth of study effort. If you work fulltime on your project, this means that your project will take 8 months. Adding one month of holiday, it will take you roughly 9 months.
At the end of your MSc Project, you will deliver a MSc report and give a final presentation. At that point, your MSc project will be graded by a committee of experts.
More information on the graduation policy is available here.
We maintain a list of presently available MSc projects. So be sure to check these out if your interest is piqued!
Of course if you already have your own project in mind, we encourage you to propose it to us. We will advise you on its feasibility, and judge whether there's a match between your project and our available expertise.
When you're ready, contact Dr. Maksim Kitsak by e-mailing at
At this moment, the future evolution of COVID-19 is unclear. We propose the Network Inference-based Prediction Algorithm (NIPA) to forecast the future course of COVID-19. We apply NIPA to the current situation in The Netherlands on a province-based level using data from the RIVM: https://www.rivm.nl/coronavirus-covid-19/actueel. For more information on NIPA, please read our article on arXiv: https://arxiv.org/abs/2002.04482.
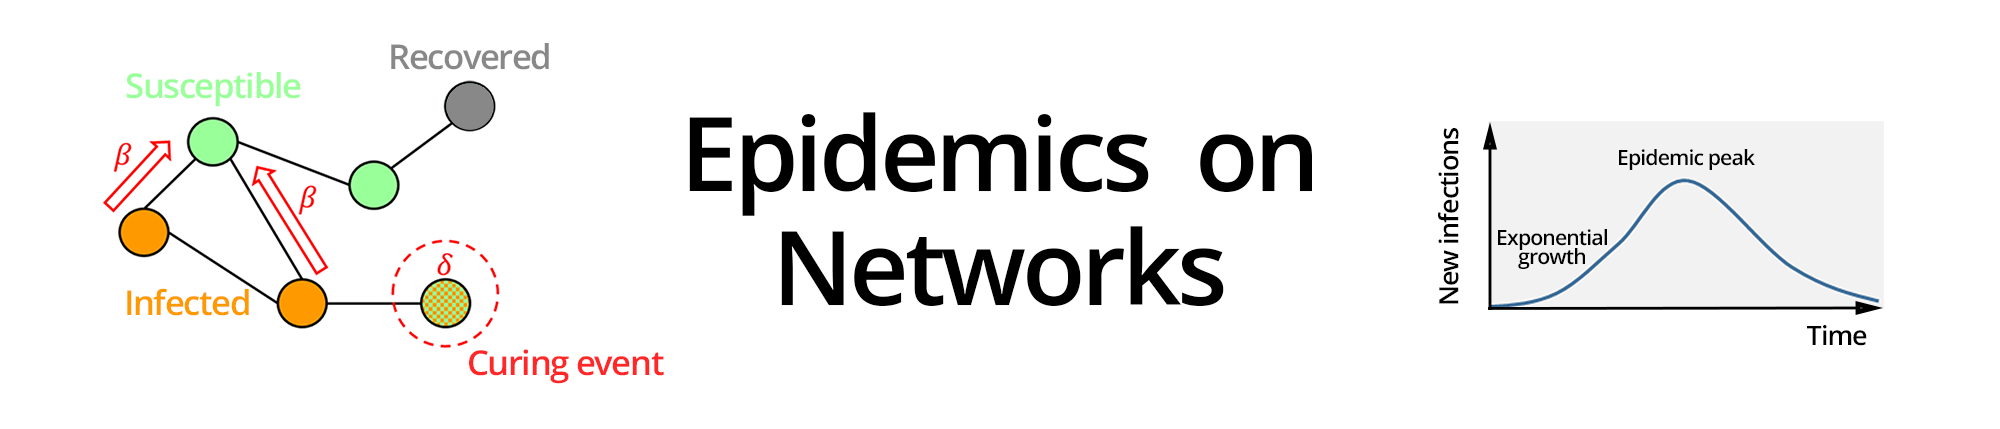
Predicting real epidemic outbreaks like COVID-19 is difficult due to underreporting. Please see our extended abstract on the fundamental limits of predicting epidemic outbreaks.
For the latest predictions on COVID-19 in the Netherlands, please visit: http://networkdatascience.ewi.tudelft.nl
Basic reproduction number R0
The basic reproduction number R0 is the average number of individuals that are infected by a typical infected individual. In Figure 2, we compute the reproduction number R0 from NIPA using formula (4) in "Reproduction numbers and sub-threshold endemic equilibria for compartmental models of disease transmission" by Van den Driessche and Watmough (2002). Before March 30, the reproduction number R0 is larger than 1, corresponding to an increasing number of newly infected cases. After April 14, the reproduction number R0 drops below 1, which indicates that the disease is slowly dying out.
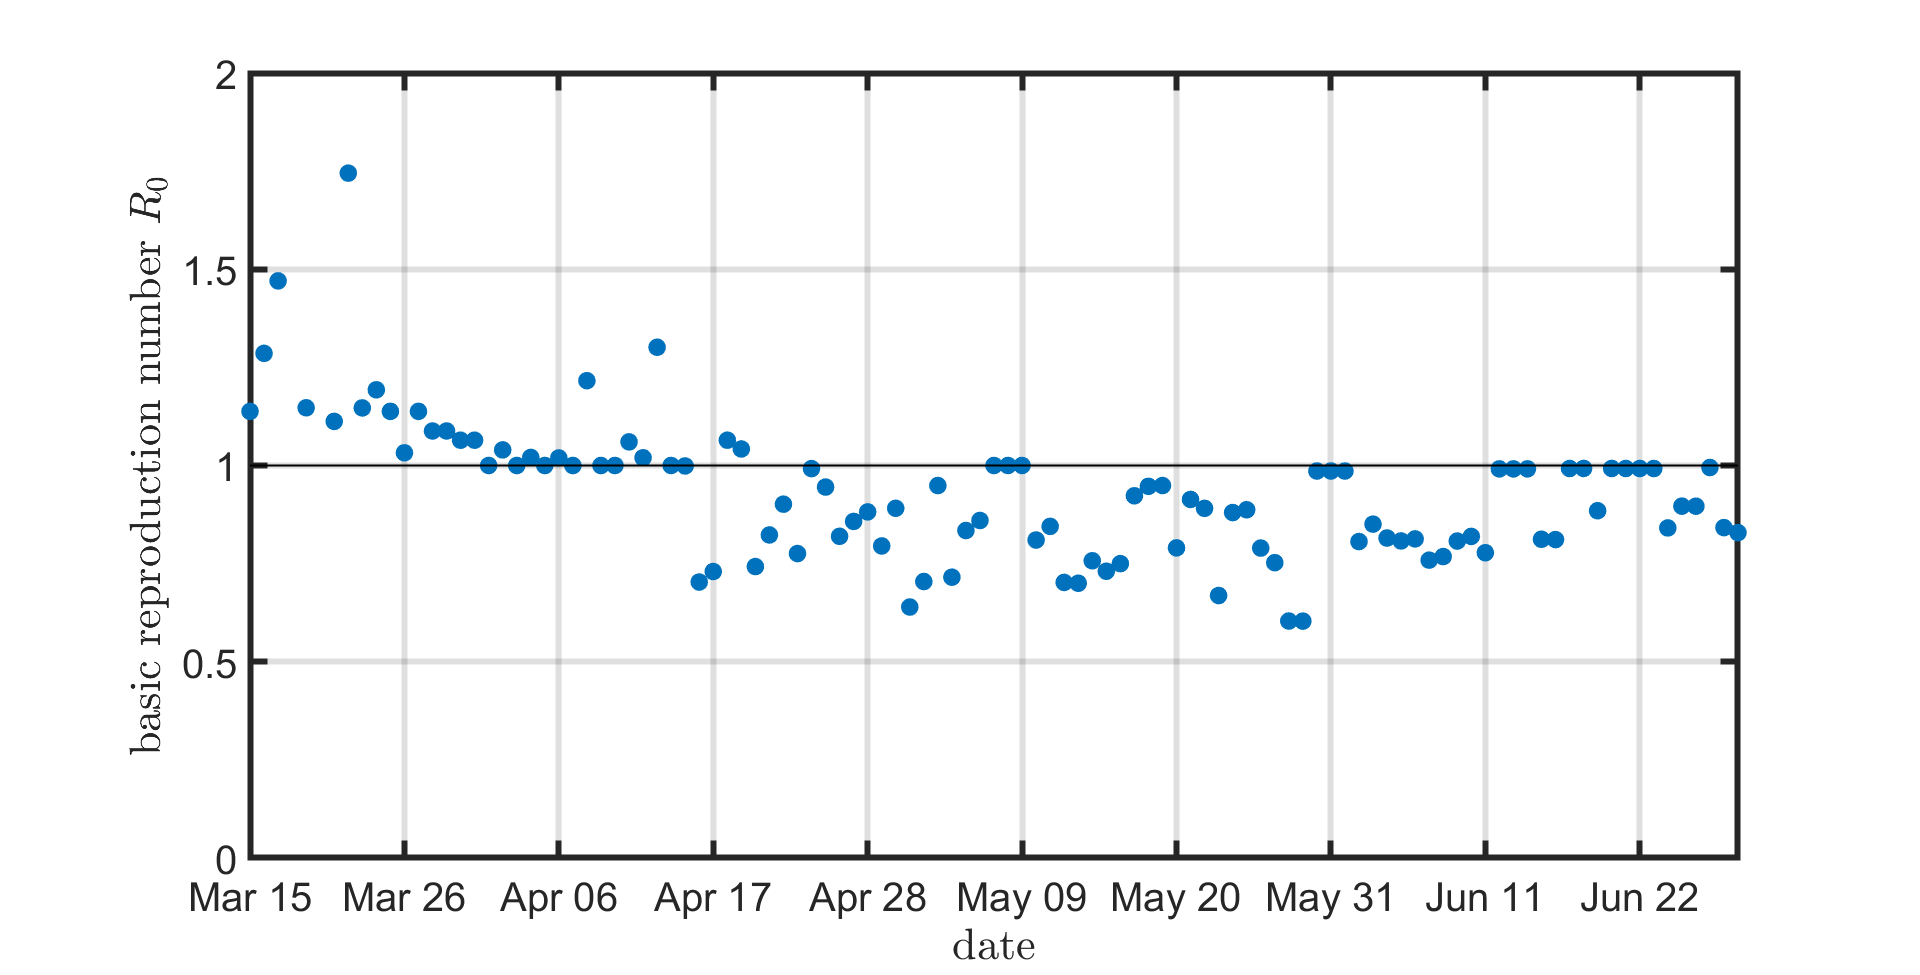
Figure 2: The basic reproduction number is slowly decreasing over time. Before March 16, the number of
data points is small, leading to large fluctuations of the basic reproduction number R0.
Daily new cases
The number of daily reported COVID-19 cases per province is shown in Figure 3. Prediction of the future course of the epidemic is difficult due to the large variations in the data.
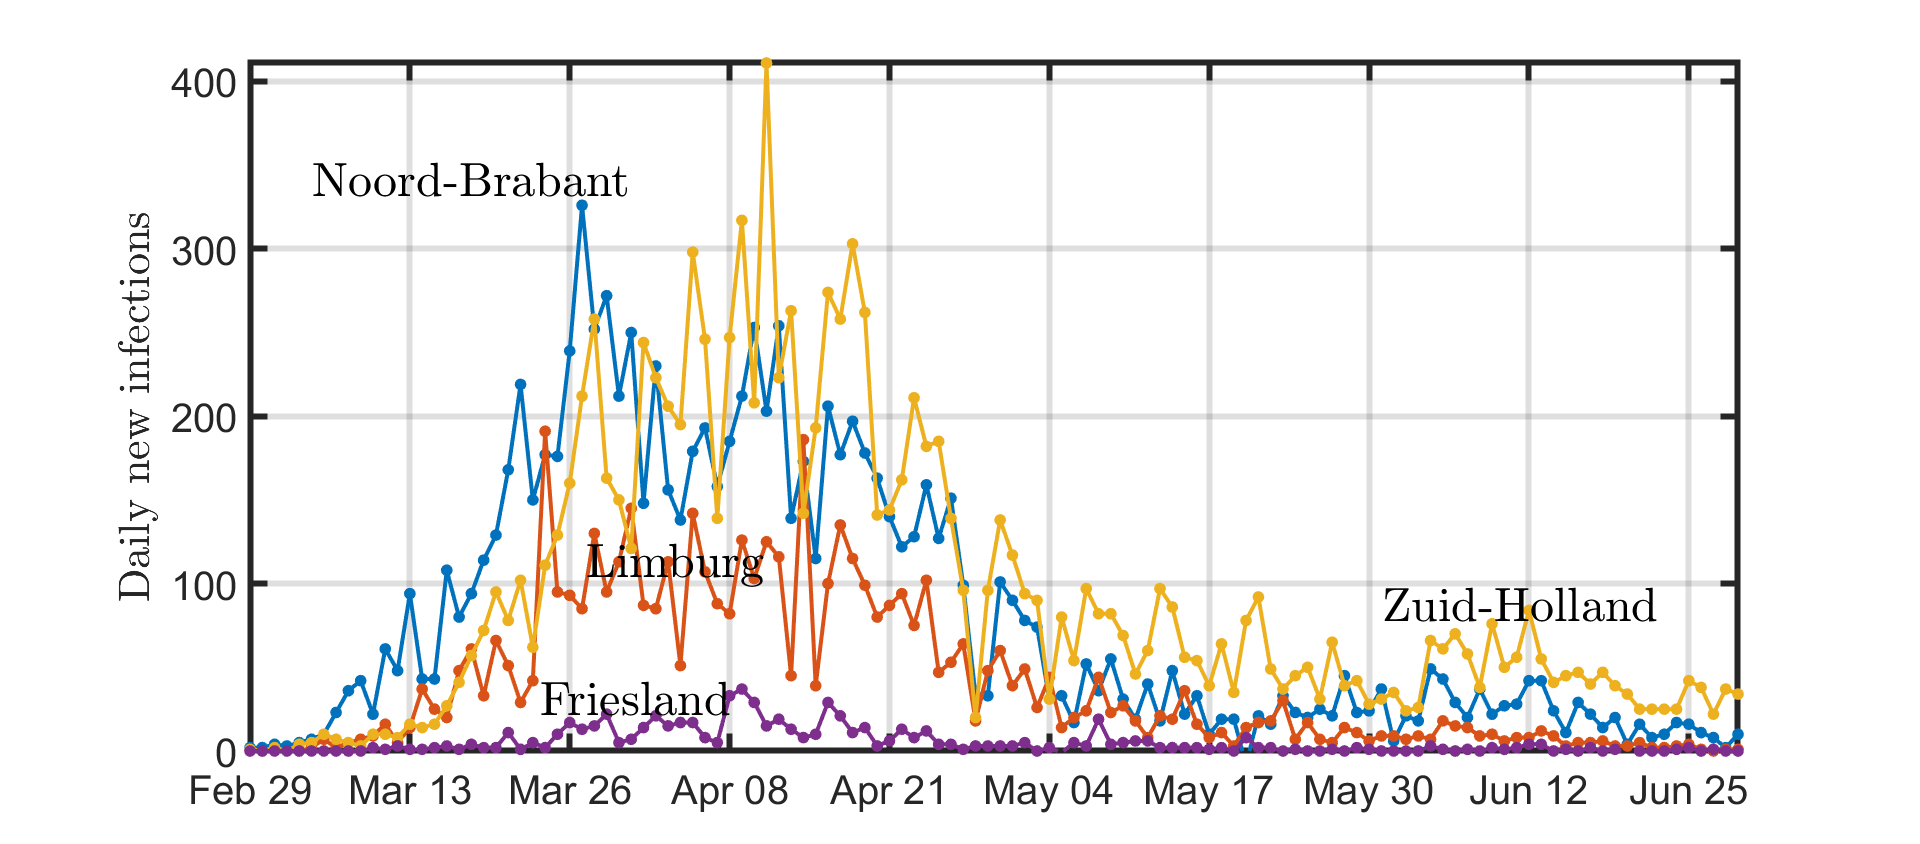
Figure 3: The number of daily reported COVID-19 cases per province. For clarity, only four out of 12 provinces are shown.
Evaluating NIPA
To evaluate the prediction accuracy of NIPA, we remove the data for a fixed number of days, say m, prior to April 2. The prediction is then computed based on observations from 29 February to 2-m April, 2020. Then, we predict the course of the disease up to April 2. The course of the disease is shown in Figure 4 for the removal of m=1,2,3,4 days. The short-term prediction is generally quite accurate, whereas the curves start to deviate (especially for Noord-Brabant) for 3 or 4 days ahead.
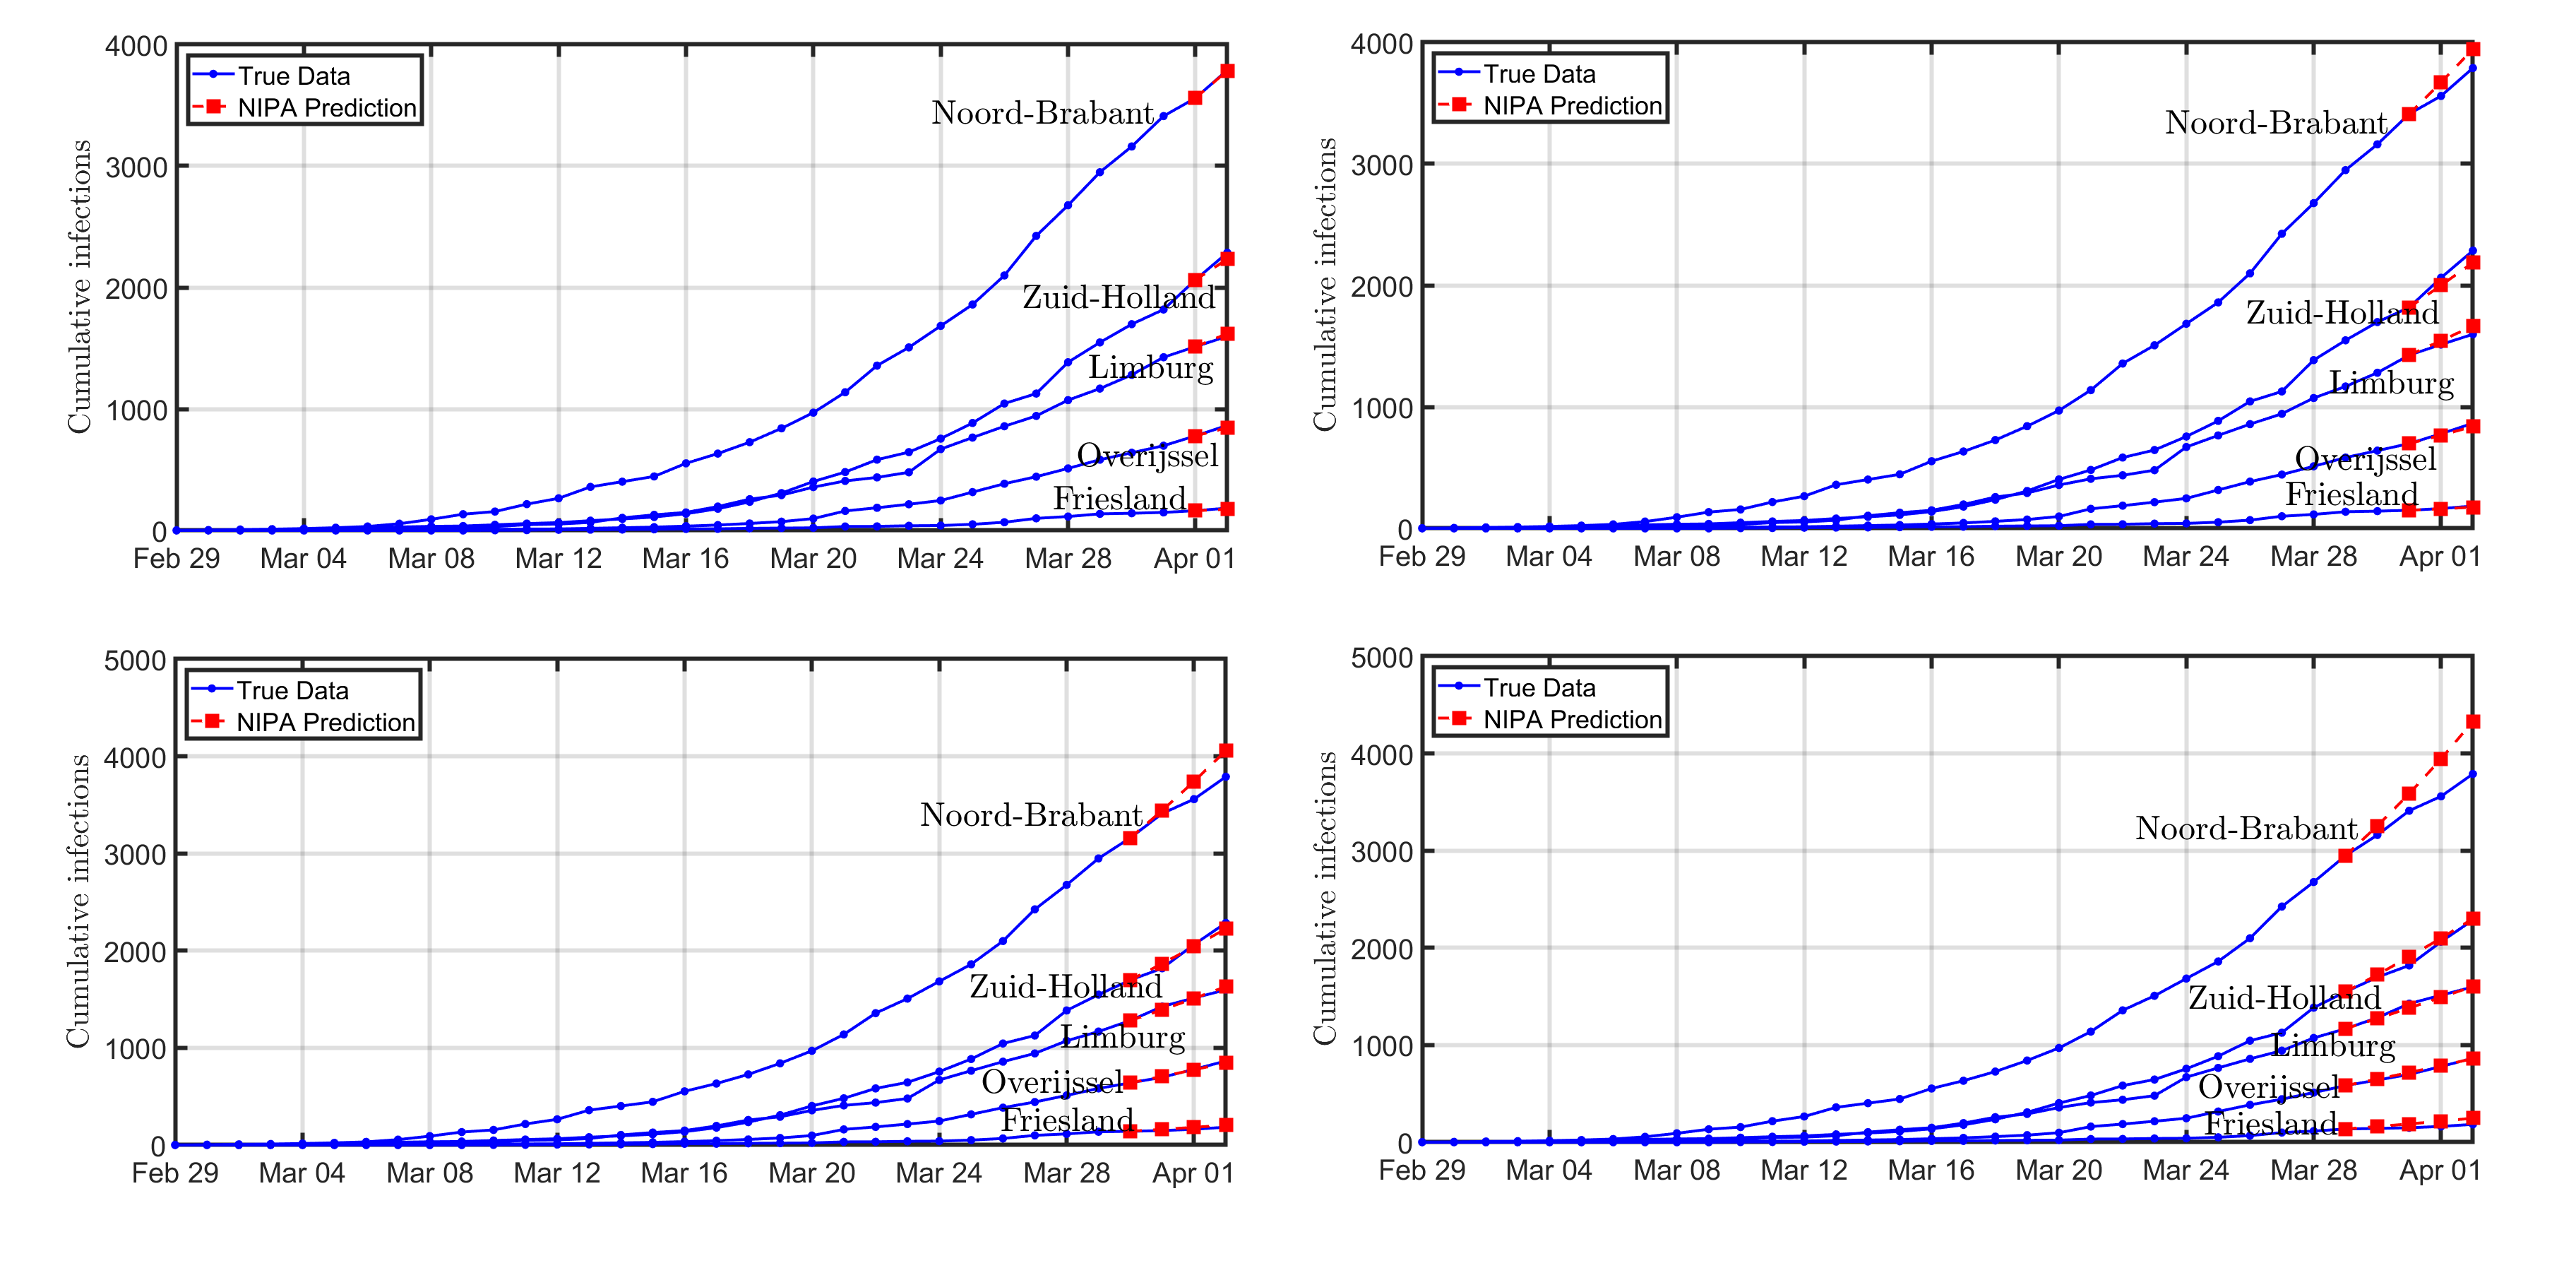
Figure 4: The prediction of the COVID-19 outbreak in The Netherlands by NIPA. For clarity, only five out of 12 provinces are shown. Each subfigure is obtained by omitting a number m=1,2,3,4 of days prior to April 2, and subsequently predicting the same number of days ahead in time. The omitted number of data points is equal to: (top-left) m=1 day, (top-right) m=2 days, (bottom-left) m=3 days, (bottom-right) m=4 days. The first prediction data point, for instance April 1 in the top-left figure, coincides with the last day that has been observed.